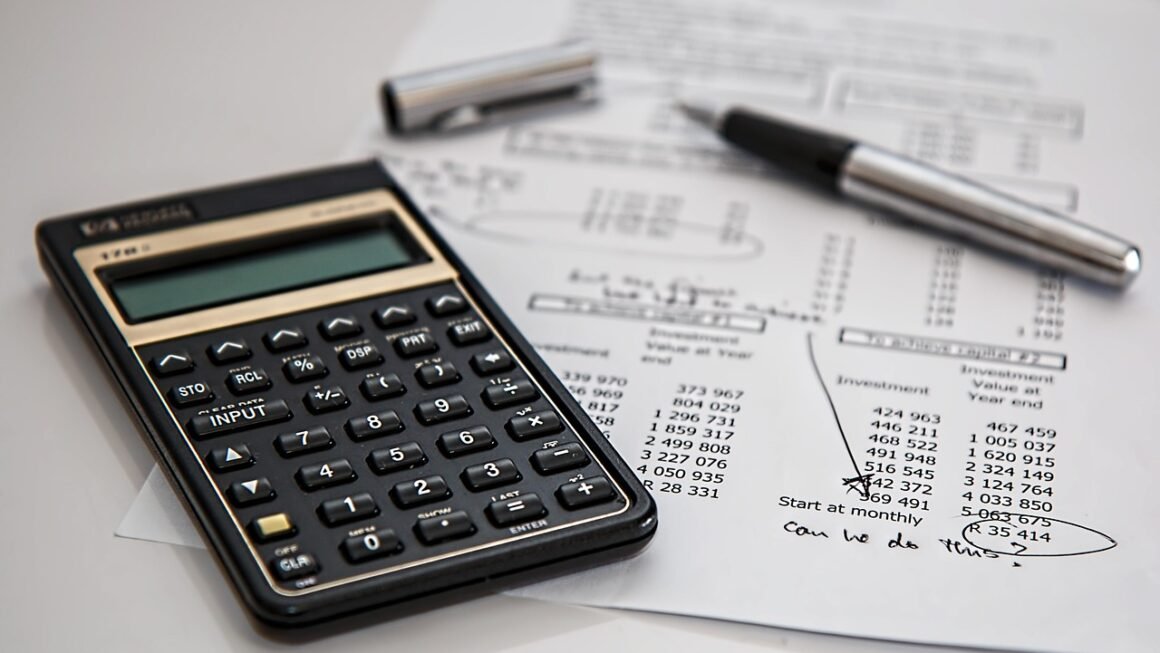

In the complex world of business and finance, understanding a company’s financial health is paramount. While profit and loss statements tell you about performance over a period, and cash flow statements track money in and out, there’s one critical document that offers an immediate, precise snapshot of where a company stands financially at a specific moment in time: the balance sheet. Think of it as an X-ray for your business, revealing the structure of everything it owns, owes, and the residual value belonging to its owners. Mastering the balance sheet isn’t just for accountants; it’s an indispensable skill for business owners, investors, and anyone looking to make informed financial decisions.
What is a Balance Sheet?
The balance sheet is one of the three core financial statements that every business produces. Unlike the income statement, which covers a period (e.g., a quarter or a year), the balance sheet provides a static view, a snapshot, of a company’s financial position at a precise date, often at the end of a fiscal quarter or year. It’s a fundamental report that summarizes a company’s assets, liabilities, and owner’s equity.
Definition and Purpose
At its core, a balance sheet answers three key questions about a business:
- What does the company own? (Assets)
- What does the company owe? (Liabilities)
- What is the owners’ stake in the company? (Equity)
Its primary purpose is to provide stakeholders with a clear understanding of a company’s financial structure and overall financial health. This “snapshot” allows for the assessment of liquidity (ability to meet short-term obligations), solvency (ability to meet long-term obligations), and the capital structure (how assets are financed).
The “Snapshot” Analogy
Imagine taking a photograph of your business at midnight on December 31st. That’s what a balance sheet does. It captures all the financial elements exactly at that moment. This contrasts sharply with an income statement, which is more like a video showing performance over an entire year, or a cash flow statement, which tracks the movement of money over a period. The balance sheet’s static nature makes it uniquely powerful for evaluating current financial strength.
The Fundamental Balance Sheet Equation
Every balance sheet adheres to a fundamental accounting principle, often referred to as the “accounting equation.” This equation is the backbone of the balance sheet and ensures that the report always balances, providing a verifiable representation of a company’s financial status.
Assets = Liabilities + Equity: The Core Principle
This simple yet profound equation dictates that everything a company owns (its assets) must have been financed either by borrowing money (creating liabilities) or by the owners investing their own capital and retaining earnings (equity). It represents the two sides of the financing coin for all business resources.
Let’s break down each component:
- Assets: These are economic resources controlled by the company that are expected to provide future economic benefits. Essentially, they are what the business owns.
- Liabilities: These are obligations of the company to transfer economic benefits to other entities in the future as a result of past transactions or events. These are what the business owes.
- Equity (or Owner’s/Shareholders’ Equity): This represents the residual claim on the assets of the company after deducting its liabilities. It’s the owners’ stake in the business.
Understanding Each Component in Context
The equation signifies that the total value of what a company owns is always equal to the sum of what it owes to outsiders and what it owes to its owners. If these don’t balance, there’s an error in the accounting. This balance is critical for maintaining financial integrity and transparency.
Actionable Takeaway: Always verify that your balance sheet adheres to this fundamental equation. Any discrepancy indicates a recording error that needs immediate attention.
Deconstructing the Components: Assets
Assets are what a company owns, and they are typically categorized based on their liquidity—how quickly they can be converted into cash.
Current Assets
These are assets that are expected to be converted into cash, sold, or consumed within one year or one operating cycle, whichever is longer. They represent the resources readily available for day-to-day operations.
- Cash and Cash Equivalents: The most liquid assets, including physical cash, checking accounts, savings accounts, and short-term investments easily convertible to cash.
- Accounts Receivable: Money owed to the company by customers for goods or services delivered on credit.
- Inventory: Goods available for sale, raw materials, and work-in-process.
- Prepaid Expenses: Payments made in advance for services or goods to be received in the future (e.g., prepaid rent, insurance).
Non-Current (Long-Term) Assets
These are assets that are not expected to be converted into cash or used up within one year. They are typically held for long-term use in the business operations.
- Property, Plant, and Equipment (PP&E): Tangible assets used in operations, such as land, buildings, machinery, vehicles, and office equipment. These are typically depreciated over their useful life.
- Long-Term Investments: Investments in other companies’ stocks or bonds that are intended to be held for more than a year.
- Intangible Assets: Assets that lack physical substance but have economic value, such as patents, copyrights, trademarks, brand recognition, and goodwill (the value of a business beyond its identifiable assets).
Practical Example: Asset Section Breakdown
Let’s look at a simplified assets section for “Innovate Tech Solutions” as of December 31, 2023:
INNOVATE TECH SOLUTIONS
Balance Sheet (Partial)
As of December 31, 2023
ASSETS
- Current Assets:
- Cash: $75,000
- Accounts Receivable: $40,000
- Inventory: $60,000
- Prepaid Rent: $5,000
- Total Current Assets: $180,000
- Non-Current Assets:
- Land: $100,000
- Building (Net of Depreciation): $250,000
- Equipment (Net of Depreciation): $120,000
- Patents: $30,000
- Total Non-Current Assets: $500,000
- Total Assets: $680,000
Actionable Takeaway: Analyze the composition of your assets. A high percentage of current assets generally indicates good liquidity, while significant investment in PP&E suggests a capital-intensive business model.
Deconstructing the Components: Liabilities & Equity
Liabilities represent what the company owes to external parties, while equity signifies the owners’ residual claim.
Current Liabilities
These are obligations that are due within one year or one operating cycle. They represent the company’s short-term financial obligations.
- Accounts Payable: Money owed by the company to its suppliers for goods or services purchased on credit.
- Short-Term Loans: Loans that must be repaid within one year.
- Accrued Expenses: Expenses incurred but not yet paid (e.g., salaries payable, utilities payable).
- Unearned Revenue: Cash received for goods or services that have not yet been delivered (e.g., a customer pays in advance for a subscription service).
Non-Current (Long-Term) Liabilities
These are obligations that are not due within one year. They represent the company’s long-term financial obligations and funding sources.
- Long-Term Bank Loans: Loans with repayment terms extending beyond one year.
- Bonds Payable: Debt instruments issued by the company to raise capital, with repayment due in more than one year.
- Deferred Tax Liabilities: Taxes that are owed but are not expected to be paid for more than one year, often due to differences in accounting and tax rules.
Owner’s Equity (Shareholders’ Equity)
This section represents the owners’ residual claim on the assets of the business after all liabilities have been paid. For publicly traded companies, it’s called shareholders’ equity.
- Contributed Capital (Common Stock/Paid-in Capital): The initial investment made by the owners or shareholders into the company.
- Retained Earnings: The cumulative net income of the company that has been retained in the business rather than being distributed to shareholders as dividends.
Practical Example: Liabilities & Equity Section Breakdown
Continuing with “Innovate Tech Solutions” and its Total Assets of $680,000, here’s how the Liabilities and Equity section might look:
INNOVATE TECH SOLUTIONS
Balance Sheet (Partial)
As of December 31, 2023
LIABILITIES & EQUITY
- Current Liabilities:
- Accounts Payable: $35,000
- Short-Term Bank Loan: $20,000
- Accrued Salaries: $15,000
- Unearned Revenue: $10,000
- Total Current Liabilities: $80,000
- Non-Current Liabilities:
- Long-Term Bank Loan: $200,000
- Total Non-Current Liabilities: $200,000
- Total Liabilities: $280,000
EQUITY
- Common Stock: $150,000
- Retained Earnings: $250,000
- Total Equity: $400,000
Total Liabilities & Equity: $680,000
Notice that the Total Liabilities & Equity ($680,000) perfectly matches the Total Assets ($680,000), fulfilling the balance sheet equation.
Actionable Takeaway: Monitor your debt levels. A high proportion of liabilities, especially short-term ones, compared to equity can signal higher financial risk.
Reading and Interpreting Your Balance Sheet for Financial Health
A balance sheet is more than just a list of numbers; it’s a diagnostic tool. By analyzing key figures and ratios, you can gain deep insights into a company’s financial health, performance, and risk profile.
Key Financial Ratios from the Balance Sheet
Several critical ratios can be derived directly from the balance sheet to assess different aspects of financial health:
- Current Ratio:
Current Assets / Current Liabilities- Purpose: Measures a company’s ability to meet its short-term obligations. A ratio of 2:1 (or 2.0) is often considered healthy, meaning a company has twice as many current assets as current liabilities.
- Example: Innovate Tech Solutions: $180,000 (Current Assets) / $80,000 (Current Liabilities) = 2.25. This indicates good short-term liquidity.
- Debt-to-Equity Ratio:
Total Liabilities / Total Equity- Purpose: Assesses the extent to which a company is financed by debt versus owner’s funds. A lower ratio typically indicates less financial risk.
- Example: Innovate Tech Solutions: $280,000 (Total Liabilities) / $400,000 (Total Equity) = 0.70. This suggests the company is primarily funded by equity, which is generally positive.
- Working Capital:
Current Assets - Current Liabilities- Purpose: Represents the capital available to a business for day-to-day operations. Positive working capital is essential for operational fluidity.
- Example: Innovate Tech Solutions: $180,000 – $80,000 = $100,000. A healthy amount for daily operations.
What to Look For
- Trends Over Time: Compare balance sheets from different periods to identify patterns. Are assets growing? Is debt increasing faster than equity?
- Composition of Assets: Is too much capital tied up in slow-moving inventory or outdated equipment?
- Reliance on Debt vs. Equity: A company heavily reliant on debt might be riskier, especially during economic downturns.
- Adequacy of Cash: Does the company have enough cash to cover immediate needs without selling off assets?
Actionable Takeaway: Regularly calculate and track these ratios. Benchmark them against industry averages and your company’s historical performance to identify strengths, weaknesses, and potential red flags.
Why the Balance Sheet is Indispensable for Decision-Making
The balance sheet is far more than a compliance document; it’s a powerful tool that informs strategic decisions for various stakeholders.
For Business Owners and Management
- Assessing Liquidity and Solvency: Provides critical insights into the company’s ability to meet both short-term and long-term financial obligations, preventing potential cash flow crises or bankruptcies.
- Making Investment Decisions: Helps evaluate the allocation of assets. Are investments in PP&E generating sufficient returns? Is there too much cash sitting idle?
- Evaluating Financial Structure: Guides decisions on how to finance growth—whether through debt, equity, or retained earnings.
- Strategic Planning: Supports long-term planning by revealing the foundational strength (or weakness) of the business.
For Investors
- Understanding Risk and Return: Investors use the balance sheet to gauge a company’s financial stability, leverage, and asset base before committing capital. A strong balance sheet signals lower risk.
- Assessing Long-Term Viability: It helps determine if a company has the resources and financial structure to sustain operations and grow over the long haul.
For Lenders and Creditors
- Evaluating Creditworthiness: Banks and other lenders heavily rely on the balance sheet to assess a company’s ability to repay loans. They look at collateral (assets) and debt levels.
- Determining Loan Terms: A healthy balance sheet can lead to more favorable loan terms, including lower interest rates and higher credit limits.
Actionable Takeaway: Incorporate balance sheet analysis into your monthly or quarterly financial review meetings. Use it as a basis for discussions on capital allocation, debt management, and growth strategies.
Conclusion
The balance sheet stands as a foundational pillar of financial reporting, offering an invaluable snapshot of a company’s financial health at a specific point in time. By meticulously detailing assets, liabilities, and owner’s equity, it provides a crucial lens through which to understand a business’s structure, liquidity, and solvency. Mastering its components and learning to interpret its insights is not merely an accounting exercise, but a vital skill that empowers business owners, investors, and lenders alike to make informed, strategic decisions.
Embrace the balance sheet as your financial compass, guiding you through the complexities of business finance and empowering you to steer your enterprise towards sustained success and stability. Regular review and analysis will not only ensure compliance but will also unlock profound insights into your company’s true financial standing and future potential.